
Based on a report titled “Global Trends in Renewable Energy Investment 2020”, by UNEP’s Economy Division in cooperation with Frankfurt School – UNEP Collaborating Centre for Climate & Sustainable Energy Finance
Renewable energy capacity, excluding large hydro, grew by a record 184 GW in 2019. This was 20 GW, or 12 per cent, more than new capacity added in 2018. Yet the 2019 dollar investment was only 1 per cent higher, at $282.2 billion. Meanwhile, the all-in cost of electricity continues to fall for wind and solar, thanks to technology improvements, economies of scale and fierce competition in auctions. Costs for electricity from new solar PV plants in the second half of 2019 were 83 per cent lower than a decade earlier. This is great progress, but there is room to do much more. Nations and corporations have made clean energy commitments over the next decade. Analyzing them, UNEP’s report on Global Trends in Renewable Energy Investment 2020 finds commitments for 826 GW of new non-hydro renewable power capacity by 2030, at a likely cost of around $1 trillion. However, these commitments fall far short of what is needed to limit the rise in global temperatures to less than 2 degrees Celsius under the Paris Agreement. It also falls short of last decade’s achievements, which brought around 1,200 GW of new capacity for $2.7 trillion. Following are the key trends and findings from the report.
Government 2030 renewable energy targets
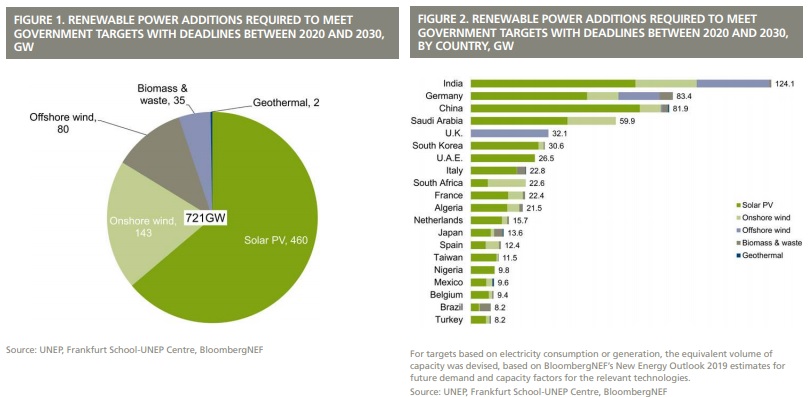
Governments around the world have written into official policy, or put into law, targets that would raise the amount of renewable power capacity installed by 2030. The figures, drawn from analysis by BloombergNEF, indicate that some 721 GW of wind, solar, biomass and waste to-energy, geothermal and marine power plants would need to be built over the coming decade to meet those targets. One clear message from Figure 1 is that governments as a whole have been more ambitious about setting targets for solar than they have for any other non-hydro renewable energy technology. This reflects the fact that three countries (China, India and Germany) would need to build a further 70 GW, 68 GW and 48 GW respectively by 2030 or earlier, in order to meet their ambitious solar targets. The U.K., India and Germany would need to build 32 GW, 30 GW and 17 GW respectively, to meet their offshore wind targets. In addition, governments have official targets to install 488 GW of hydro-electric capacity, large and small, by 2030.
Private sector renewable energy targets
The figure below shows the sharply rising trend in the number of corporations joining the RE100 group, which brings together organizations that have set a target to source 100 per cent of their power from renewables by a particular date in the future. Prominent members of RE100 include Apple, Facebook and Microsoft, all of which have been prolific signatories of renewable energy power purchase agreements, but also a wide range of companies from countries as diverse as Japan, the U.K. and India. The list includes 19 of the 100 largest companies in the world by revenue. And this is just the tip of the iceberg. Corporations are making these efforts in order to help demonstrate the sustainability of their business models, as well as for economic reasons.

BloombergNEF estimates that these RE100 members would need to source an additional 210 TWh of green electricity by 2030. Meeting this 210 TWh shortfall by 2030 could underpin 105GW of new solar and wind plant construction globally by 2030, if the current members relied solely on offsite solar and wind power purchase agreements (PPAs). For context, this is more than the UK’s 101 GW power fleet, and comes on top of 16.4 GW of existing PPAs already signed by RE100 members. It may be that the total new renewable energy capacity built as a result of RE100 commitments turns out to be even greater than this.
Investment implied by the targets
The estimates above, based on actual commitments by governments and companies, imply a total of 826 GW of new non-hydro renewable energy capacity would need to be built between now and 2030. The actual investment involved in building these gigawatts would depend on the mix of renewable energy technologies chosen (for example, offshore wind has a much higher average capital cost per megawatt than solar photovoltaics), on where the new capacity is located, and also on how the costs of those technologies evolve during the 2020s.
At 2019 global benchmark capital costs per megawatt, 826 GW of new capacity might have an upfront capital cost of some $900 billion – if the technology split was 75:25 between utility-scale PV and onshore wind. Or $1.1 trillion if it was 70:20:10 between utility-scale PV, onshore wind and offshore wind. However, the consensus expectation is for the costs for all three of those technologies to continue to fall during the 2020s – not necessarily as spectacularly as they did in the decade just ended, but still appreciably, as manufacturing techniques improve further and (in offshore wind) even larger and more powerful machines are introduced.
Dollars deployed so far
The figure below shows that the world invested $282.2 billion in renewable energy capacity in 2019, some $2 billion more than in the previous year. The total for last year was made up of $230.1 billion of financings for utility-scale renewable energy projects of more than 1 MW, down 5 per cent on the 2018 total; and $52.1 billion of spending on small-scale solar systems of less than 1 MW – up 37 per cent.

Global investment in renewables capacity has been relatively consistent since 2014, fluctuating in a $50 billion range between $265 billion and $315 billion. But beneath the headline figures, much has been changing on the unit costs of new additions, on the geographical split of investment, and on the mix between different technologies. Looking at the sector dimension first, Figure 9 highlights again how wind and solar tower over the other renewable energy technologies in terms of investment. Last year, wind attracted a record $138.2 billion, up 6 per cent on 2018, while solar got $131.1 billion, down 3 per cent and its lowest since 2013. The key reasons for this were the further rise in activity in offshore wind, both off the coasts of Europe and in the sea off mainland China and Taiwan; and the downward trend in costs per megawatt for solar photovoltaics.
Biomass and waste-to-energy maintains a consistent third place among renewable energy sectors, with investment in 2019 up 9 per cent at $9.7 billion. There were strong pockets of activity last year, notably in waste incineration plants in the U.K. and China. The remaining sectors all languished in terms of dollars committed in 2019. Small hydro-electric projects of less than 50 MW saw investment slip 3 per cent to $1.7 billion, while geothermal had a 56 per cent decline to $1 billion on a paucity of large new project financings. Biofuels took $500 million in new investment, down 43 per cent and the lowest for three years, while marine (tidal and wave) energy saw no significant new financings at all.
The geographical split arguably offered more surprises in 2019 than the sectoral one. Figure 10 shows that the leading regions for investment were once again China, the U.S., Europe and Asia-Pacific excluding China and India. However, their relative contribution shifted, with China slipping back, and the U.S. overtaking Europe. The Other Americas (excluding the U.S. and Brazil) region was a strong feature, investment there rising 28 per cent to $12.6 billion, while Brazil enjoyed a 74 per cent rebound to $6.5 billion.

Among various countries, the two most spectacular risers were Taiwan, with a near-quintupling of its investment volume to $8.8 billion thanks mainly to a trio of offshore wind deals; and the United Arab Emirates, with a 13-fold increase to $4.5 billion on the back of the largest solar project financing anywhere in history.
One of the trends in recent years has been the widening geographical spread of investment in renewables. In 2018, this was manifest in the highest number ever of economies investing $1 billion or more. In 2019, the signal on this was a record number investing more than $2 billion, at 21 – up from 20 in 2018 and 16 in 2017. Europe started off as the dominant investor in renewables, and it remained the largest until it was overtaken by China in 2013 – as the solar booms in Germany and Italy cooled off dramatically and China raised its ambitions in both photovoltaics and wind. China has been the dominant location for investment ever since, but its lead over the other two major markets peaked in 2017 – when it installed an unprecedented 53 GW of solar, half of the world’s total that year – and has since been shrinking. The US lost its second place to China in 2009, won it back in 2011 as the Obama administration’s ‘green stimulus’ took effect, but then slipped back into third place until 2019, when it overtook Europe for the first time.
The figure below shows that developing economies accounted for the majority of global investment in renewables capacity for the first time in 2015, and have maintained that since. In 2019, they represented $152.2 billion out of the world total of $282.2 billion, a 54 per cent share. This was the same proportion as in 2018, but down from 2017’s share of 62 per cent. What 2019 did produce of note, however, was the highest ever figure for renewables capacity investment in ‘other developing countries’ – excluding China and India. This jumped 17 per cent to $59.5 billion, and was double the equivalent total for 2016.

Technology split
Figure 21 shows the year-on-year change in renewable energy capacity investment worldwide, with two additional elements. One is the split in solar between utility-scale projects of more than 1 MW, at $79 billion, and spending on small distributed PV systems. In 2019, overall solar capacity investment slipped 3 per cent globally to $131.1 billion, but within this utility-scale asset finance dropped 19 per cent – due in large part to a sharp slowdown in the financing of PV projects in China. However, money committed to small-scale solar systems around the world, including commercial and residential installations, jumped 37 per cent to $52.1 billion, its highest level since 2012. The latest declines in the cost per MW of small solar systems made them more cost-competitive.
What is also clear from Figure 21, however, is that other sectors of renewable energy (apart from wind and solar) attracted few capital spending commitments in 2019. Small hydro projects of less than 50 MW and geothermal plants saw investment of $1.7 billion and $969 million respectively, well down on historic peaks in 2011 ($7.3 billion for small hydro, $3.1 billion for geothermal). Marine energy continued to languish, with wave power still to solve technology challenges and megawatt-scale tidal stream projects blocked by lack of specific policy support in the key markets of the U.K. and France. Biofuels saw capacity investment of just $500 million, far below the peak of $22.9 billion way back in 2007, as the industry stagnated without fresh government purchasing mandates.

Offshore wind saw investment surging 19 per cent to a record $29.9 billion in 2019. Behind this was a fourth-quarter rush of deals, including one in U.K. waters but also the first financial close in the French offshore program and a third transaction in Taiwan’s, to add to two earlier in the year. But the biggest factor was a stampede of mainland China offshore wind projects, brought to financial close in order to qualify for a feed-in tariff soon to expire. Onshore wind investment edged up 2 per cent to $108.3 billion in 2019, also an all-time high. The two main reasons for this were a 7 per cent advance in deal volume in China to $41 billion, and a 42 per cent leap in U.S. financings to $31.5 billion – the latter to take advantage of the Production Tax Credit incentive, which was due to finish its qualifying period at the end of 2019.
Asset finance
The figure below highlights the two main ways in which projects are financed – either on-balance-sheet by utilities, energy companies and developers, or on a non-recourse basis via a special purpose vehicle, or SPV, set up for that specific project (non-recourse project finance). In the first approach, the company or companies that own the project may raise bond or other debt finance to help pay for construction, but this will be done via their own corporate balance sheets. They will therefore bear the whole risk of project execution. In the second approach, the developer is likely to own all or part of the equity in the SPV, but this will usually be supplemented by the raising of debt – so that only a proportion of the project risk will reside with the developer. In both cases, the project may well be refinanced once it is operational, since the financing terms available at this lower-risk stage of the life of a renewable energy plant are usually more advantageous than those available pre-construction. However, this chart deals only with the financing mode used for construction, not the one used later in the operating phase.

In 2019, on-balance-sheet financing made up $148.6 billion, or 65 per cent, of the renewable energy asset finance total of $230.1 billion, while nonrecourse project finance accounted for $81.1 billion, or 35 per cent. The bond/other category, which includes leasing, continued to be only a tiny proportion of the total, at $327 million last year significantly down on 2018’s $2 billion. The split between on-balance-sheet and nonrecourse finance has always favored the former during the period since 2004. This is partly because many of the largest investors in renewables are utilities or independent power producers that prefer to take this approach for ease of execution, and then possibly refinance the project later. Also, the non-recourse structure that is very familiar in Europe, North America and China may be less easy to adopt in newer markets where risks are less well understood by domestic and international banks.

The above table shows the largest asset financings of 2019. Inevitably, the list does not give an accurate picture of the mix of investment overall, because it tends to favor those sub-sectors that typically have large investment volumes per project. Consequently, last year, there were 11 offshore wind arrays in the 14 top projects, due to the size of these investments, even though onshore wind and PV are both much larger than offshore in terms of global investment dollars allocated. The biggest-ticket project reaching financial close in 2019 was the Al Maktoum IV solar thermal complex in Dubai, at $3.9 billion for 700 MW, consisting of 100 MW of tower technology and 600 MW of the more established parabolic trough technology. Not shown in the list, because the BNEF database counts it as a separate project, is that Al Maktoum IV has a PV element – of 250 MW and $400 million. The overall package for Al Maktoum IV, at $4.3 billion, signed in March 2019, was the largest ever asset finance deal in solar, and the largest nonrecourse project finance package in any renewable energy technology.
The list highlights the extent of the surge in offshore wind activity in East Asia. It includes the first three Taiwanese arrays to get financed, each of them involving a mix of local and European finance players. It also includes five projects from mainland China. Another 13 from there got the investment go-ahead in 2019, but have not been included in the list due to investment size.
Venture capital & private equity
Venture capital and private equity investment in renewable energy rose 22 per cent to $3 billion. This was its highest level since 2015, but less than a third of its peak in 2008. Early-stage and late-stage venture capital investments both saw large percentage increases from low levels, but PE expansion capital fell by 22 per cent to $1.8 billion to scarcely a quarter of its 2008 peak. The main renewable energy technologies, and the companies that manufacture them, are now mature, so there is less need for these earlier-stage forms of financing than there was more than a decade ago.

Two other factors have also contributed to the lower trajectory in VC/PE financing of renewables compared to the earlier period. One is that much of the research in the main sectors of wind, solar and biomass and waste-to-energy is now taking place inside large companies rather than in small ventures. The other is that early-stage funds had distinctly mixed results with their investments in green energy previously, with many of their investee companies struggling in the face of the fierce competition in solar manufacturing, in particular. Some of those investors have now moved onto other low-carbon industries such as electric transport and energy storage. Electric vehicles saw two VC/PE deals of more than $1 billion in 2019, and batteries one.
Nevertheless, renewable energy did see sizeable year-on-year increases in some of its own sectors in 2019. VC/PE investment in solar rose 29 per cent to $1.8 billion, and for wind it jumped 157 per cent to $529 million, with project developers rather than manufacturers or technology pioneers often taking the new capital. In the tiny marine sector, where technology development is at an early stage, VC/PE investment quadrupled to $6 million on the basis of just two small deals, involving Scottish and French tidal turbine developers. By geography, India was by far the biggest market, with VC/PE investment up 169 per cent at $1.4 billion. In second place came the U.S., down 8 per cent at $797 million, and Europe was third, climbing 14 per cent to $443 million.

India secured four of the five largest deals, two each in wind and solar, as shown in the table above, several of which attracted foreign investors. In the year’s biggest VC/PE deal, worth $824 million dollars, the wind, hydro and solar developer Greenko Energy Holdings was bought out by GIC, Singapore’s sovereign wealth fund, and the Abu Dhabi Investment Authority. In the next largest, Canada Pension Plan Investment Board, the Abu Dhabi Investment Authority and Goldman Sachs acquired a minority stake in ReNew Power, a wind and solar generator, for $300 million. Abu Dhabi also acquired a minority stake in Hero Future Energies, a wind and solar operator, paying $150 million via the state-owned Masdar Capital.
Public markets
In public markets, investment in renewable energy companies grew 11 per cent to $6.6 billion, just a third of the peak reached in the boom year of 2007. Public markets are quieter these days because the main sectors, solar and wind, are now dominated by well-established global companies with less need to tap investors. The amount of money raised through IPOs jumped 47 per cent to $2 billion, but again, this was scarcely a sixth of its 2007 peak. Investment in secondary and PIPE offerings inched up 4 per cent to $2.9 billion, while that in convertibles fell 6 per cent to $1.7 billion.

As usual, solar received the most public market investment, up 19 per cent to $3.6 billion, and wind the second largest, up 63 per cent at $2.4 billion. Biofuel investment more than trebled to $306 million, while small hydro also jumped thanks to a single IPO in which the Indonesian hydropower generator Kencana Energi Lestari raised $21 million.

Among the fifteen largest, six were secured by investment funds and yieldcos, with U.K.-quoted wind funds prominent among them. In the largest deal, Greencoat UK Wind raised $488 million in a secondary offering. Another U.K.-quoted fund, The Renewables Infrastructure Group, or TRIG, found its fundraising three times over-subscribed, and raised almost twice as much as originally expected. It ended up launching two issues – one secondary, one convertible – and raised a total of $370 million. Yet another U.K.-quoted fund, Aquila European Renewables Income Fund, raised $173 million through an IPO. Terraform Power, the U.S. ‘yieldco’ now controlled by Brookfield Renewable Partners, raised $251 million through a secondary offering. Project developers, which tend to need regular injections of capital, were also prominent. The largest of these was a $466 million IPO by Xinyi Energy Holdings, which builds and operates solar plants. The next largest was another IPO, in which the Shapoorji Pallonji Group of India floated its subsidiary Sterling & Wilson Solar, raising $414 million.
Acquisition activity
The value of acquisitions fell sharply in 2019, ending a five-year run of strong growth. Deals worth $100.7 billion were recorded globally, down 34 per cent from the peak of $151.5 billion in 2018. All asset classes saw declines, but to varying degrees: public market exits disappeared altogether, while private equity buy-outs shrank by 76 per cent to just $3.2 billion, having peaked the previous year at $13 billion. Less precipitous but nonetheless significant was the 32 per cent drop in asset acquisitions to $83.8 billion, which was $40 billion less than in the previous year. In contrast, the volume of corporate M&A deals remained relatively high – at $13.7 billion, it was only marginally lower than the $14.6 billion seen in 2018.

As in previous years, most acquirers bought power generators and developers rather than equipment manufacturers or service providers. Indeed, acquisitions of generating assets accounted for 83 per cent of all money changing hands – despite the dramatic reduction in volume in 2019 – while generators or developers were the target in eight of the 10 largest corporate M&A deals. The year’s two largest private equity buy-outs saw investors buy a major Spanish wind developer and a German offshore wind farm. The decline in renewable energy acquisitions took place amid global economic uncertainty and after sharp sell-off on stock markets in late 2018, partly due to worries about a possible trade war between the U.S. and China.
In recent years, activity has become increasingly concentrated in wind and solar (see Figure below). In 2019, they took almost 97 per cent of the total, which was a slight increase on the year before. Among the remainder, slightly less than $2 billion was recorded in biomass and waste-to-energy, a record low for that sector, while less than $1 billion was seen in geothermal, small hydro and biofuels. The marine sector has seen very little acquisition activity in recent years.

In contrast to the declines in asset acquisitions and PE buy-outs the volume of corporate transactions was more resilient, dropping just 6 per cent to $13.7 billion in 2019. This was slightly up on 2017 but a small fraction of the $29.5 billion trade in companies that took place in 2016. As in previous years the targets were mostly renewable energy developers or generators, but in a break with the past more than half the deals took place in Asia. In the biggest deal of the year, RWE acquired E.ON Climate & Renewables and its 5GW of renewable generating capacity for $3.9 billion. The transaction formed part of a wider $27 billion asset swap between two German utilities that are pursuing very different strategies – RWE has divested from downstream areas to concentrate on generation of all types, while E.ON has chosen to focus on downstream distribution and retail. The deal is further evidence of the growing trend towards specialization among European utilities.
One of China’s largest PV module makers, JA Solar, was the target in the second-largest corporate deal of 2019, a $1.6 billion takeover that paved the way for the company to list on the Shenzhen Stock Exchange in December. Frustrated by its valuation on Nasdaq, JA Solar delisted its American depository receipts in July 2018 and saw itself acquired by Shenzhenlisted Qinhuangdao Tianye Tolian Heavy Industry Co.
PE buyouts
PE buy-outs fell to nearer long-term average levels in 2019 after two years of exceptionally high investment volumes. Some $3.2 billion was recorded, just a quarter of the $13 billion seen in 2018 and a third of the $10.6 billion the previous year. As with corporate transactions, the main focus was on wind rather than solar and on generating assets or companies instead of manufacturing businesses.
About half of all investment was accounted for by one large deal – the acquisition of more than 90 per cent of Spanish wind-power developer Eolia Renovables de Inversiones by Alberta Investment Management Corp (AIMCo) for $1.6 billion. With 669 MW of renewable assets, the purchase beefs up AIMCo’s infrastructure holdings and coincides with a move by Alberta, home to most of Canada’s oil industry, to get 30 per cent of its energy from renewables by 2030. Another notable PE deal was the purchase by Macquarie Infrastructure and Real Assets of Ocean Breeze Energy, owner of the 400 MW Bard Offshore 1 wind farm in the German North Sea. The project was developed by Bard Engineering but ownership was transferred to Italian bank Unicredit when the developer was declared bankrupt in 2013. Macquarie’s Green Investment Group was also active in acquiring offshore wind projects in 2019.
The full report can be accessed by clicking here


